The Gold-Silver Ratio Explained: Calculation, Uses, and Limits
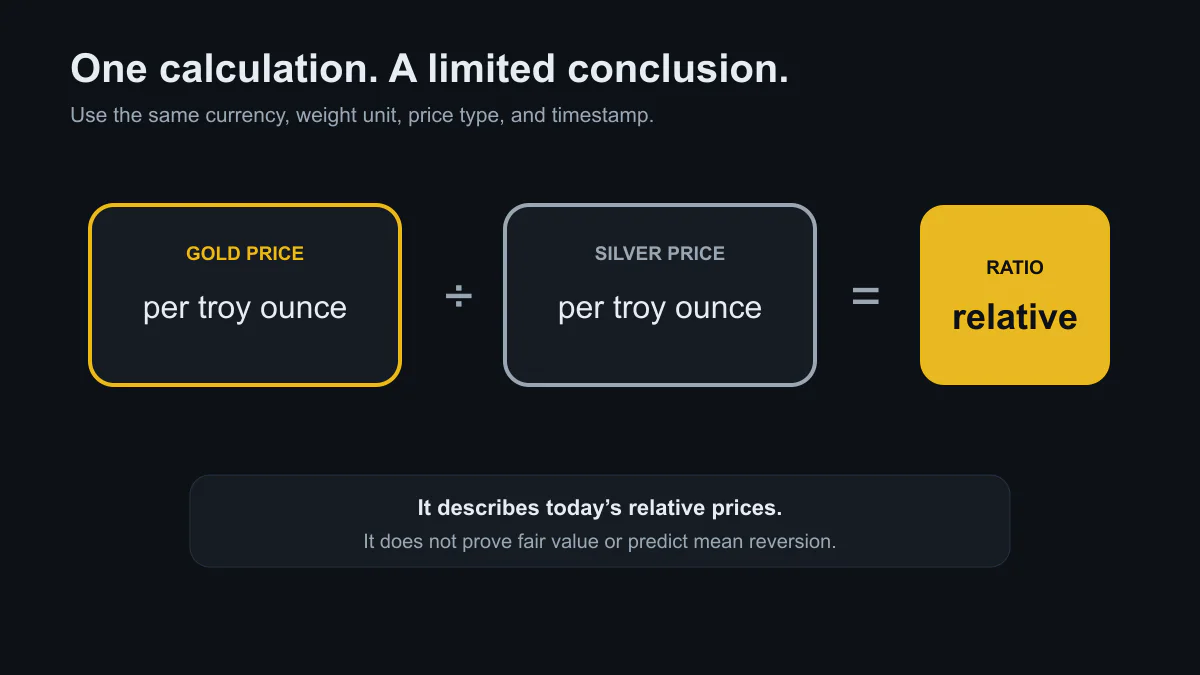
Image: GoldGram
The gold-silver ratio answers one narrow question: how many units of silver have the same quoted market value as one equal unit of gold? It is a relative-price measure, not an appraisal and not a stand-alone trading rule.
Source check: 27 July 2026. No live ratio is stated here because benchmark observations and market feeds update.
The calculation
When both metals are quoted in the same currency per troy ounce:
gold-silver ratio = gold price per troy ounce / silver price per troy ounce
For a clearly hypothetical example, if gold were $2,400 per troy ounce and silver were $30 per troy ounce at the same timestamp, the ratio would be 80. The example is arithmetic, not a current quote or forecast.
Use comparable data
A reproducible ratio needs:
- the same currency;
- the same weight unit;
- the same observation date and, for intraday data, the same timestamp;
- compatible price types, such as two benchmark auction prices or two matched futures settlements;
- a recorded source and retrieval time.
The LBMA precious-metals benchmarks include separately governed gold and silver prices. If one benchmark is set at a different time from the other, the calculated ratio still contains a timing difference. A retail coin price is unsuitable for comparison with wholesale benchmark gold because dealer premiums and product sizes enter only one side.
What changes the ratio
The ratio rises when gold strengthens relative to silver and falls when silver strengthens relative to gold. That can happen because the metals have overlapping but different demand:
- gold demand includes jewelry, bars and coins, financial products, and official-sector holdings;
- silver combines investment and jewelry demand with industrial uses;
- silver’s smaller market and industrial sensitivity can create different volatility;
- mine supply differs because much silver is produced alongside other metals.
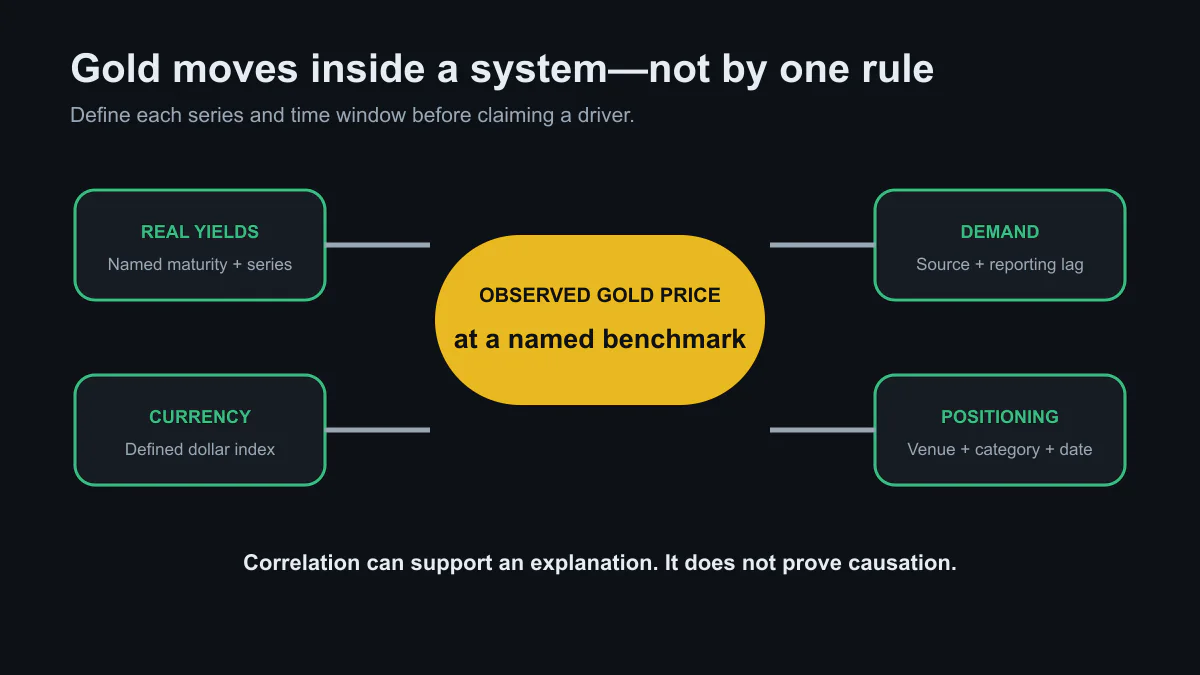
Those are possible mechanisms, not a promise that one metal must lead under a given macro condition.
Why “high” and “low” require a defined window
A statement that the ratio is historically high is incomplete unless it states the series, start date, end date, frequency, and summary statistic. A daily series since 1970 can give a different percentile from a monthly series since 2000. Government-fixed historical ratios belong to a different market regime and should not be blended casually with floating modern prices.
A sound comparison reports:
- current matched observation;
- chosen historical window;
- median and percentile within that window;
- maximum drawdown or dispersion;
- sensitivity to starting date.
What the ratio cannot tell you
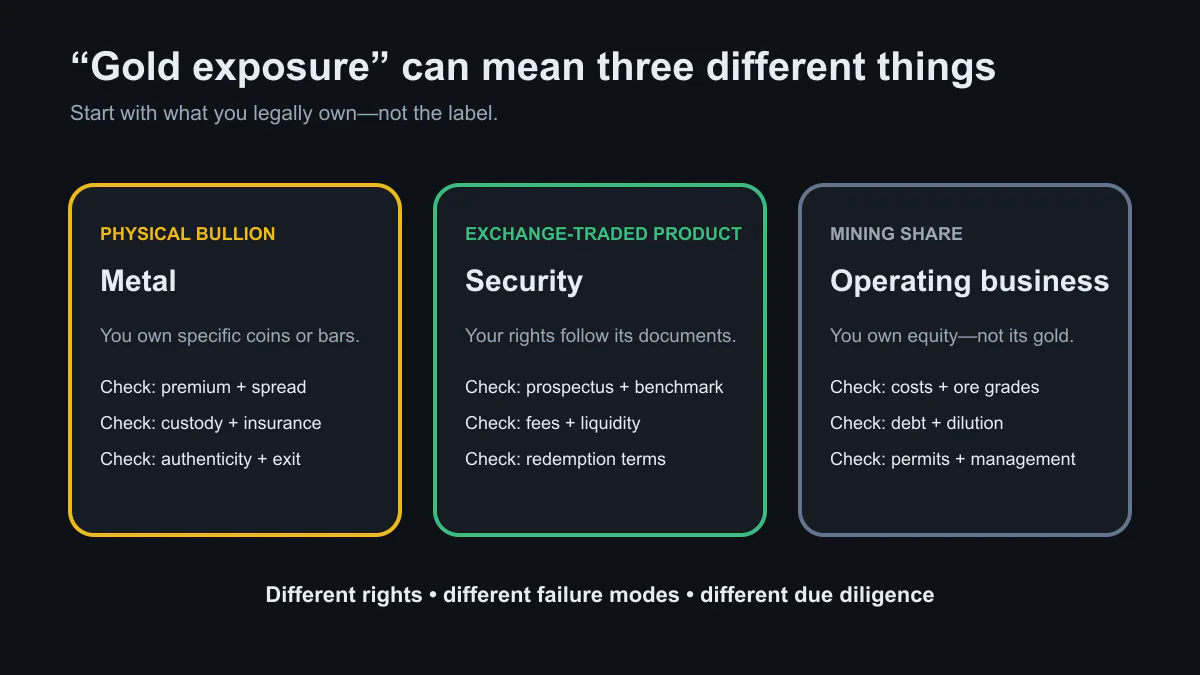
It does not show storage costs, retail premiums, taxes, liquidity, or the risk of a particular coin, fund, futures contract, or mining company. It also does not prove that the numerator is expensive, the denominator is cheap, or either price will revert to an average.
Treat a threshold crossing as a prompt to investigate the underlying markets. Any claim that a fixed ratio guarantees a profitable switch needs evidence from a stated, out-of-sample method with transaction costs included.
Primary and authoritative sources
- LBMA: precious-metals prices and benchmark information
- U.S. Mint: bullion coin definitions and specifications
- USGS: Mineral Commodity Summaries 2026
goldsilvergold-silver ratioprecious metals educationmarket explainer