Gold Outlook 2026: How to Read Forecasts
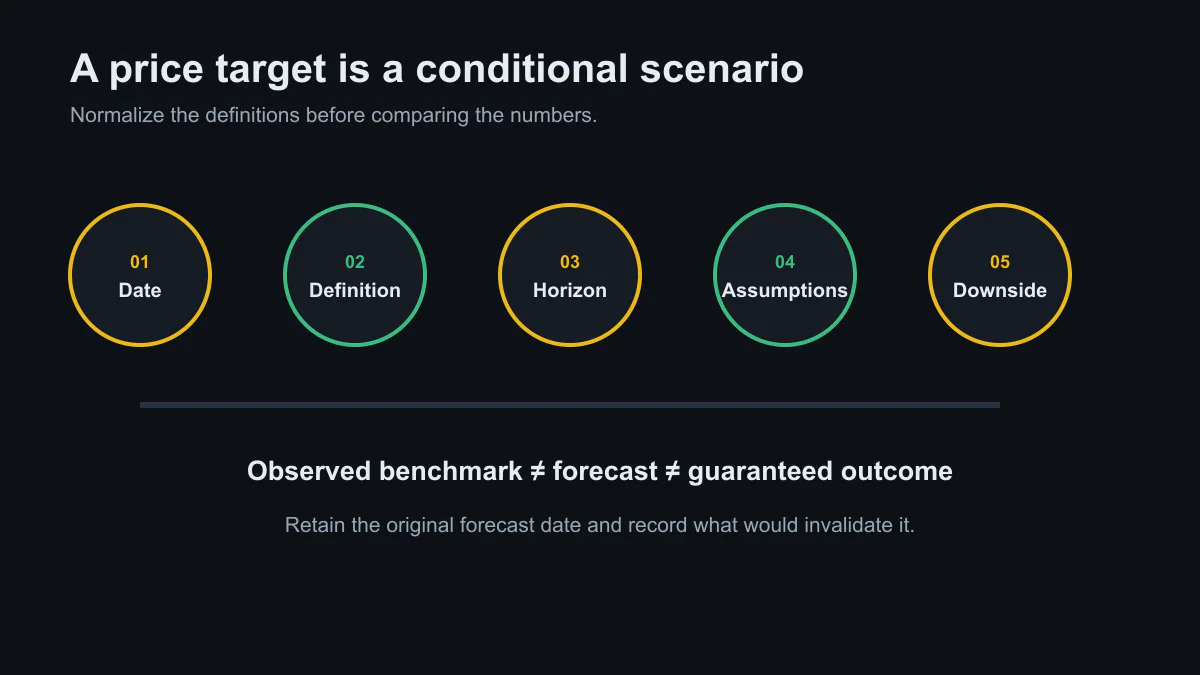
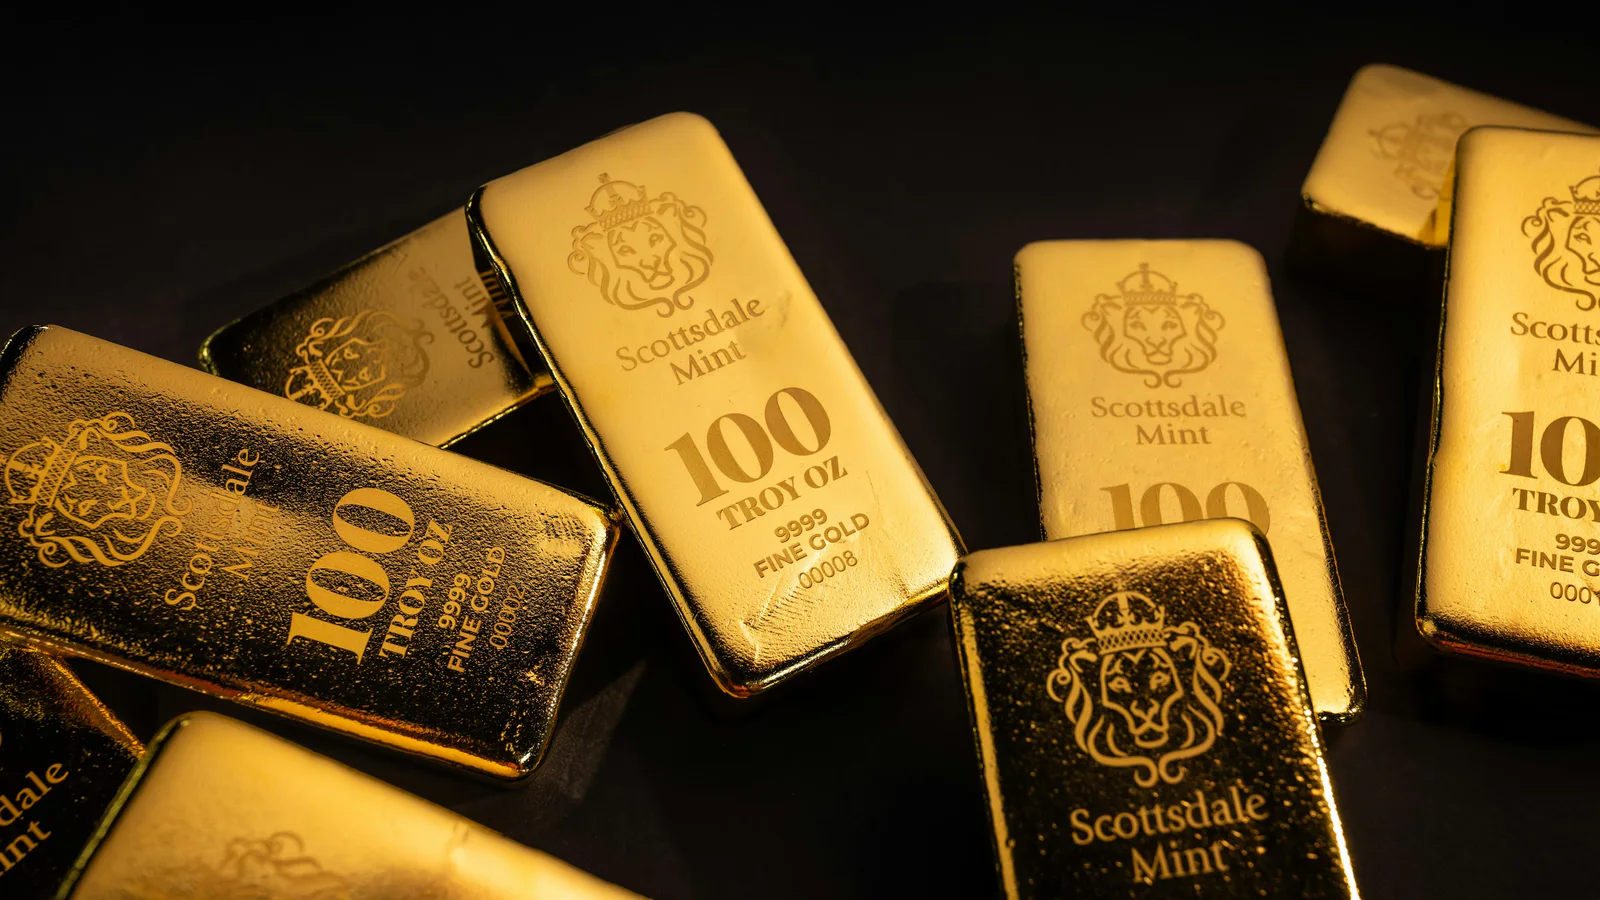
Image: GoldGram
Gold forecasts often look more precise than the evidence behind them. A target may refer to a year-end spot price, an annual average, a futures contract, or a bank’s scenario case. Putting those numbers in one table without harmonizing the definitions creates a false comparison.
This article provides a method for reading the 2026 outlook. It does not predict a price, promise a return, or recommend a trade.
Source check: 27 July 2026. Market observations below are dated; forecasts should be rechecked at their original source.
Start with the price definition
The LBMA Gold Price is an independently administered London benchmark calculated through an electronic auction. A dealer quote, a streaming “spot” feed, a futures settlement, and the retail price of a coin are different observations.
Before recording any forecast, capture five fields:
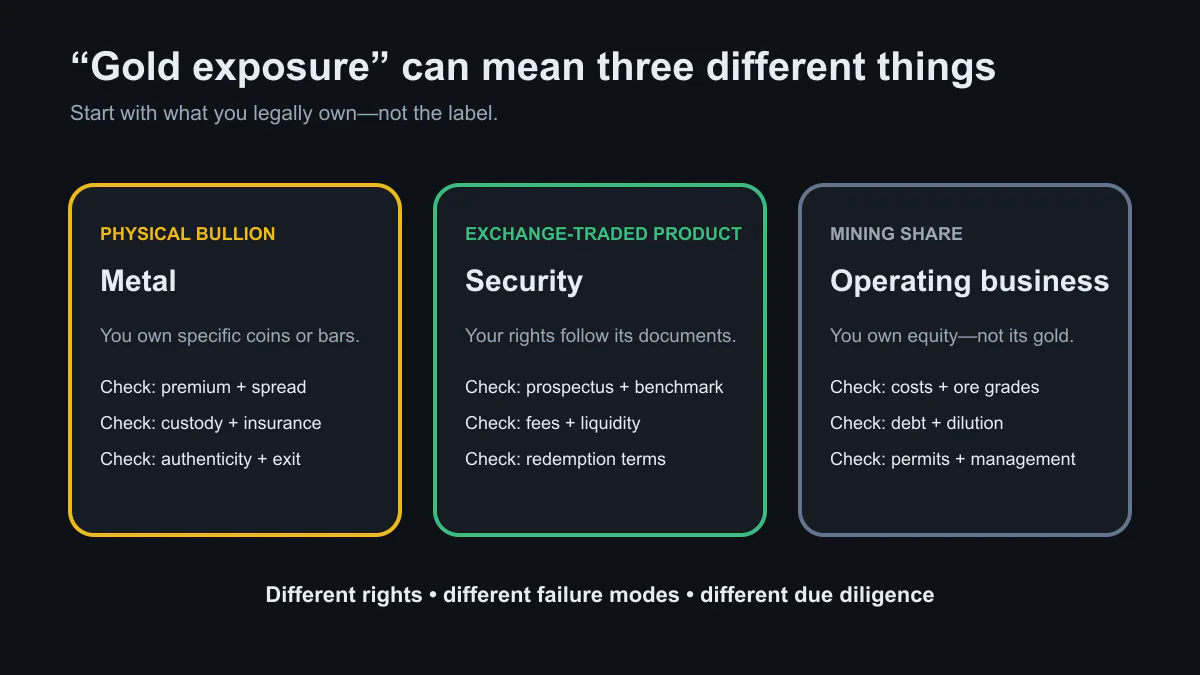
- Instrument: benchmark spot, named futures contract, retail bullion, fund share, or mining equity.
- Currency and unit: for example, U.S. dollars per troy ounce.
- Horizon: a date, quarterly average, or annual average.
- Publication date: the information set available to the forecaster.
- Case: base, upside, downside, or probability-weighted estimate.
Without those fields, two forecasts cannot be compared reliably.
Observed data is not a forecast
As of this source check, two official series illustrate variables analysts often monitor:
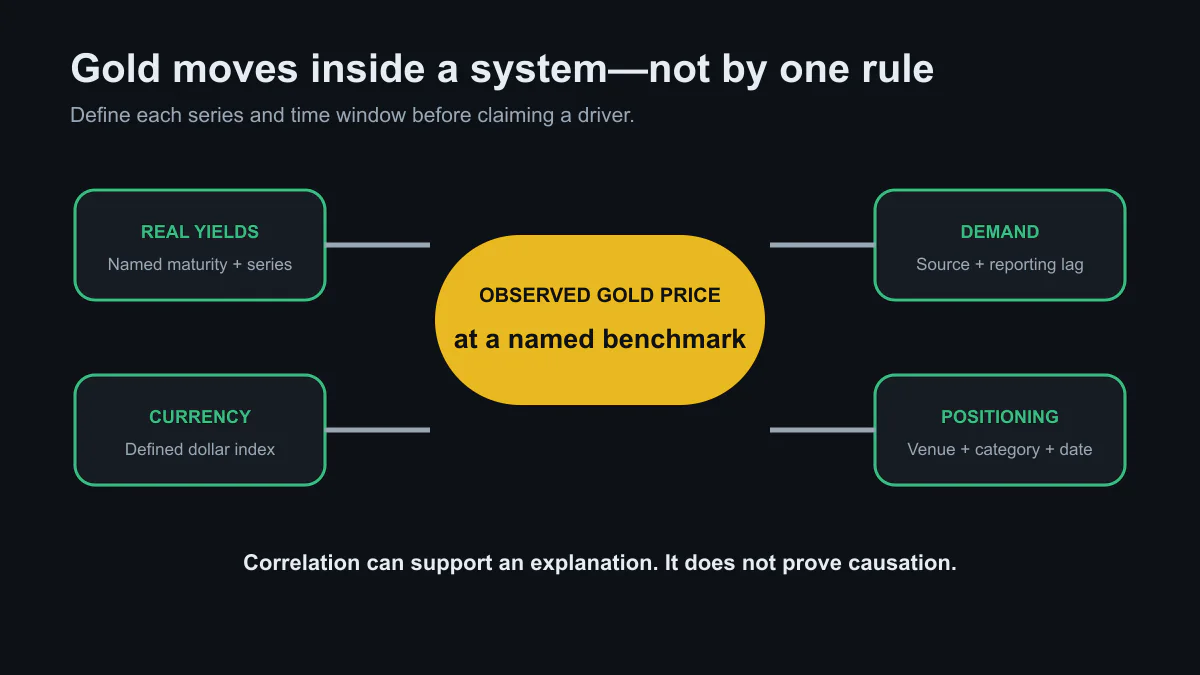
- The Federal Reserve Bank of Cleveland’s model estimated the 10-year real interest rate at 2.07686% for July 2026.
- The Federal Reserve’s Nominal Broad U.S. Dollar Index, distributed through FRED, was 120.5315 on 17 July 2026.
Those are observations from defined series. They do not, by themselves, say what gold must do next. The real-rate value is a model estimate, while the dollar index is a weighted index rather than a direct gold-price input.
Three defensible scenarios
Rather than invent a precise target, write conditional scenarios and the evidence that would support or weaken each one.
| Scenario | Conditions that could support it | Evidence that would challenge it |
|---|---|---|
| More supportive for gold | Falling real yields, a weaker broad dollar, stronger official-sector or investment demand, or greater demand for liquidity hedges | Real yields and the dollar rise while benchmark demand measures soften |
| Mixed or range-bound | Drivers offset one another; physical and investment demand diverge | Several independent drivers begin moving in the same direction |
| Less supportive for gold | Higher real yields, a stronger dollar, reduced investment demand, or forced selling during a liquidity shock | Gold holds up despite those conditions, suggesting another demand source dominates |
These are analytical cases, not price promises. Correlations change over time, and a geopolitical event can affect currency, rates, liquidity, and gold simultaneously.
How to audit a published target
Ask:
- Is the target still current, or has the forecaster issued a revision?
- Does the cited page contain the number, date, and horizon claimed?
- Is it a base case or a headline-grabbing upside case?
- Are assumptions for rates, inflation, currency, and demand stated?
- Is there a range or confidence interval?
- Does the author disclose a position, product, or commercial relationship?
A lone target without method or downside case is marketing material, not a usable forecast.
Data limits
Gold has no issuer-provided cash-flow model. Its price reflects many participants and motives, including jewelry, investment, official reserves, hedging, and short-term liquidity. Central-bank purchases are reported with lags and varying disclosure. Futures positioning covers a defined venue, not the whole market. Historical relationships with inflation, rates, or the dollar can reverse over shorter periods.
The most honest 2026 outlook is therefore a monitored set of conditions. Update the observations, retain the original forecast dates, and record when the evidence changes the scenario.
Primary and authoritative sources
- LBMA: Gold Price benchmark and governance
- FRED: Cleveland Fed 10-year real-interest-rate estimate
- FRED: Federal Reserve broad U.S. dollar index
- CFTC: Commitments of Traders reports
goldgold price2026 outlookprecious metalsreal yieldsforecasts